On the Performance of Volatility Targeting in Cryptoassets
The clustering of volatility and the negative correlation between realised volatility and the returns are two well-documented features of returns on risky assets, such as equity, bond, currencies and commodities. These features have motivated the use of volatility targeting to adjust the capital exposure to a given risky portfolio dynamically. Simply put, volatility targeting implies that the capital invested in each portfolio or risky asset is levered up (scaled down) based on the inverse of the previous month's realised variance. Such leverage adjustment helps to boost the overall portfolio performance by mitigating tail risks and drawdowns.
The theoretical foundation lies in the evolution of the risk-return trade-off over time (e.g., Moreira and Muir, 2017). Nevertheless, volatility targeting is often associated with a dramatic increase in portfolio turnover and significant time-varying leverage, which casts doubt on the usefulness of conventional volatility-managed portfolios, especially for large institutional investors with high all-in implementation costs (e.g., Cederburg et al., 2020). A simple approach towards cost mitigation is to reduce the leverage implied by volatility targeting either by using realised volatility instead of realised variance or by introducing leverage constraints as a capped exposure.
Although there is abundant evidence on the pros and cons of volatility targeting in equity markets (see Bianchi et al. 2022), more needs to be done in the context of cryptoasset portfolios. The rationale is simple; risk assets, such as cryptos, exhibit a so-called leverage effect (i.e., a negative relation between returns and volatility), so volatility scaling de facto introduces some momentum into strategies. That is, volatility often increases in periods of negative returns, causing de-leverage, as expected from a time-series momentum strategy. Historically, such a momentum strategy has performed well in cryptoasset markets (see Liu and Tsyvinski 2021).
In this article, we provide some preliminary evidence on the performance of volatility-managed cryptoasset portfolios vis-a-vis their unmanaged counterpart. Consistent with the existing literature, we evaluate the economic performance of volatility targeting in the cryptoassets space based on long-short portfolios constructed from individual asset characteristics, such as momentum, size, liquidity, volatility, market betas and on-chain activity.
A first look at volatility targeting in the crypto space
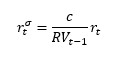
The empirical tests evaluate the performance of alternative volatility-managed implementations of a broad set of volatility-managed portfolios, each of them constructed as:
 Eq.(1)
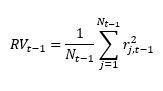
Where rσt and rt are the return on the scaled and unscaled crypto portfolios, respectively. Here c is a constant chosen such that the unconditional variance of the managed rσt and unmanaged rt portfolios coincide, and RVt-1 represents the previous month's realised variance calculated as:
 Eq.(2)
With Nt-1, the number of days in each month. Volatility targeting based on a realised variance measure such as RVt-1 represents a benchmark approach in the empirical finance literature (e.g., Moreira and Muir 2017, Cederburg et al. 2020 and Bianchi et al. 2022).
First, we consider a standard value-weighted market portfolio based on a large cross-section of cryptoassets. The portfolio composition is such that portfolio weights are proportional to the relative market capitalisation of a given asset. In addition to the value-weighted market portfolio, we consider 20 long-short portfolios constructed based on different asset characteristics. Specifically, we consider both size and momentum factors as in Liu and Tsyvinski (2021), two alternative on-chain factor portfolios based on the number of new addresses and the number of new active addresses as in Cong et al. (2021), a series of alternative liquidity factors such as the Amihud (2002) illiquidity ratio and the bid-ask spread as in Bianchi et al. (2022), as well as so-called "lottery-like" characteristics such as the relative maximum return and realised skewness as in Bianchi and Babiak (2023). For a more detailed description of all portfolios, see Bianchi and Babiak (2022).
Figure 1: Capital exposure implied by volatility scaling
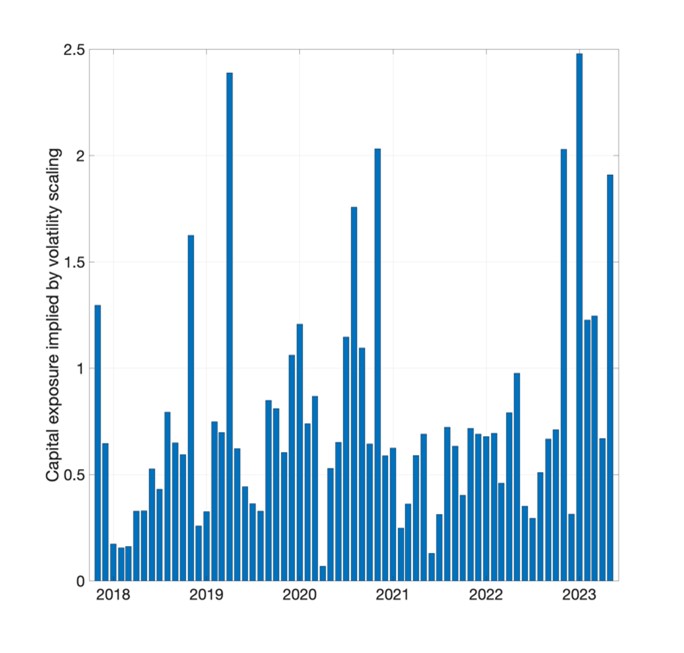
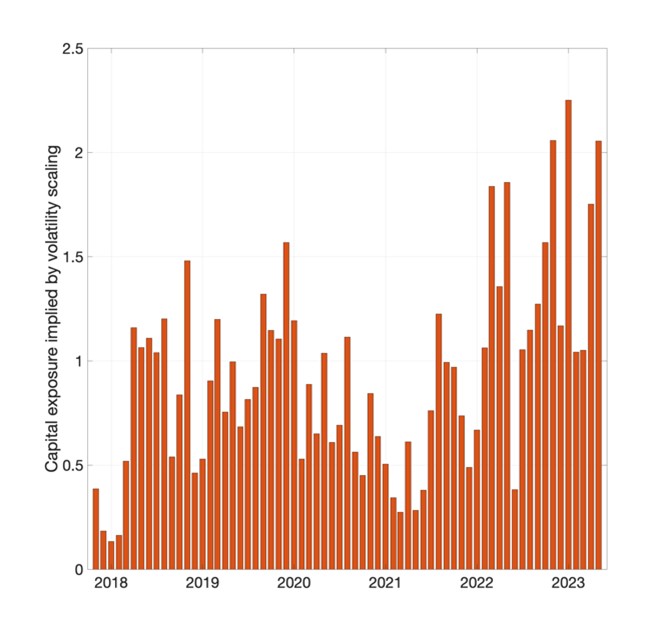
(a) Exposure to the Market portfolio (b) Average exposure across different crypto portfolios
The left panel of Figure 1 shows the capital exposure implied by Eq.(1) for the value-weighted crypto market portfolio. Two facts emerge; first, unlike in equity markets, the leverage implied by volatility targeting in cryptoassets is reasonable. For instance, the capital exposure during periods of low volatility is as high as 2.5 for the crypto market portfolio, compared to a tenfold notional exposure implied by the same adjustment in the equity market portfolio (see Bianchi et al. 2022). Second, the leverage implied by volatility targeting is counter-cyclical and persistently below one. This is due to the extreme volatility of cryptoasset market returns. The right panel of Figure 1 shows the average leverage implied by volatility targeting from Eq.(1) across all the other 20 characteristic-managed portfolios. The pattern is similar to the market portfolio, with the average notional exposure to each crypto portfolio tending to be below one and rising above one during moderately lower (compared to the whole sample) volatility periods.
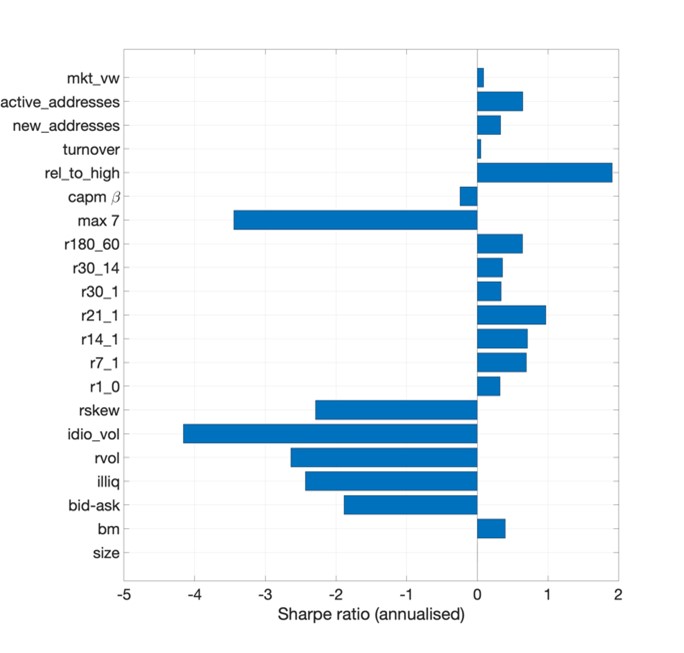
Overall, Figure 1 suggests that a typical volatility targeting strategy, as in Eq.(1), leads to a substantial, although far from extreme, portfolio adjustment, almost independent of the type of portfolio strategy. The natural step now is to understand if such an adjustment carries some economic value or improves the risk-return profile of a cryptoasset portfolio; Figure 2 outlines this. The left panel shows the annualised Sharpe ratio of the unmanaged crypto portfolios and the value-weighted market portfolio (mkt_vw). The negative Sharpe ratio of lottery-type strategies built upon past weekly maximum returns (max 7), realised skewness (rskew), illiquidity (illiq) and idiosyncratic volatility (ivol) is not surprising given the existing evidence both in equity (see Bali et al. 2011) and in cryptoassets (see Bianchi and Babiak 2023). The profitability, as proxied by a positive Sharpe ratio, of momentum strategies is also consistent with some of the existing literature, such as Bianchi and Babiak (2022).
Figure 2: Sharpe ratios of the portfolios with and without volatility targeting
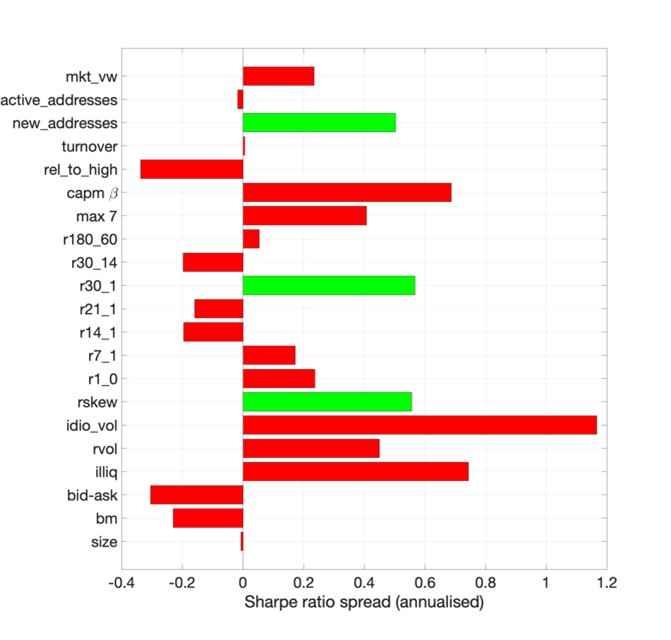
The right panel of Figure 2 reports the difference in the annualised Sharpe ratios between the volatility-managed and the unmanaged crypto portfolios. We highlight in green the Sharpe ratios of the volatility-managed portfolios that are statistically different from the original portfolios. The statistical significance is assessed by using the Ledoit and Wolf (2008) bootstrap approach. With a few exceptions, volatility targeting helps to improve the risk-adjusted returns for a comprehensive set of cryptoasset portfolios. However, the difference between volatility-managed and the original portfolios is significant at conventional statistical thresholds for long-short strategies based on new addresses, the 30-day momentum and the realised skewness (rskew). Overall, although economically valuable in absolute terms, volatility targeting does not survive the burden of statistical significance. This is consistent with existing findings in the context of equity markets (see Cederburg et al. 2020).
Spanning regressions and utility gain from volatility targeting
Whereas the results in Figure 1 provide evidence that volatility-managed portfolios do not systematically outperform original portfolios, Moreira and Muir’s (2017) spanning regression tests suggest that volatility-scaled portfolios are potentially more valuable when used in combination with their original counterparts rather than as stand-alone investments. Following the Moreira and Muir (2017) logic, in this section, we now evaluate the economic gain of incorporating volatility management in cryptoasset portfolios by estimating a series of time-series regressions of the form,
 Eq.(3)
A positive α is synonymous with an increased Sharpe ratio relative to the original portfolio return rt, resulting in pronounced utility gains for mean-variance investors. In other words, a positive alpha in Eq. (3) does indicate that the optimal ex-post combination of scaled and unscaled portfolios (with positive weight on the scaled crypto portfolio) expands the mean-variance frontier relative to the original portfolio (e.g., Gibbons et al., 1989). This point follows from the well-known link between spanning tests and portfolio optimisation under mean-variance utility (see Barillas and Shanken 2017).
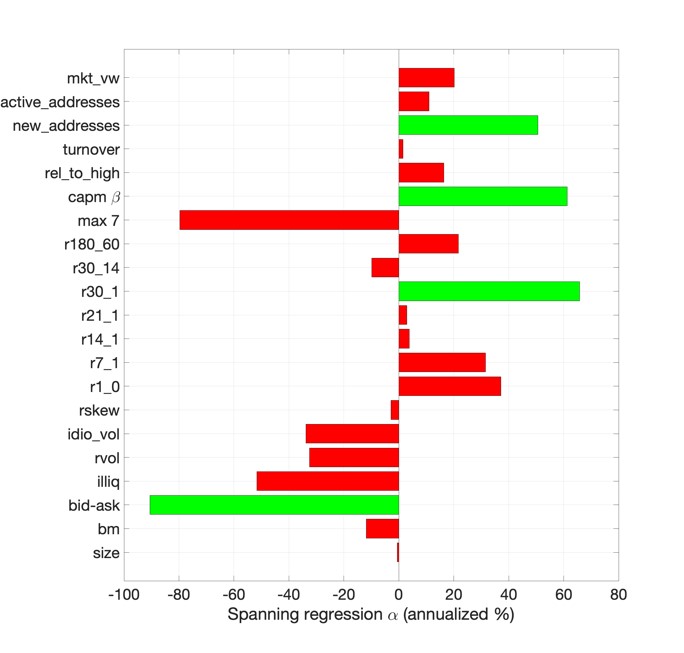
The left panel of Figure 3 shows the estimation results. The left panel shows the annualised alphas from the spanning regression as in Eq.(3). We highlight in green the alphas that are statistically different from zero at a conventional 95% confidence level. There is only a handful of alphas which are positive and statistically significant. This suggests that volatility-managed portfolios do not improve upon their original unmanaged counterparts regarding mean-variance efficiency.
An alternative way to quantify the economic relevance of volatility targeting is from the perspective of a simple mean-variance investor. Specifically, one can measure the percentage utility gain as (see Moreira and Muir 2017):
 Eq.(4)
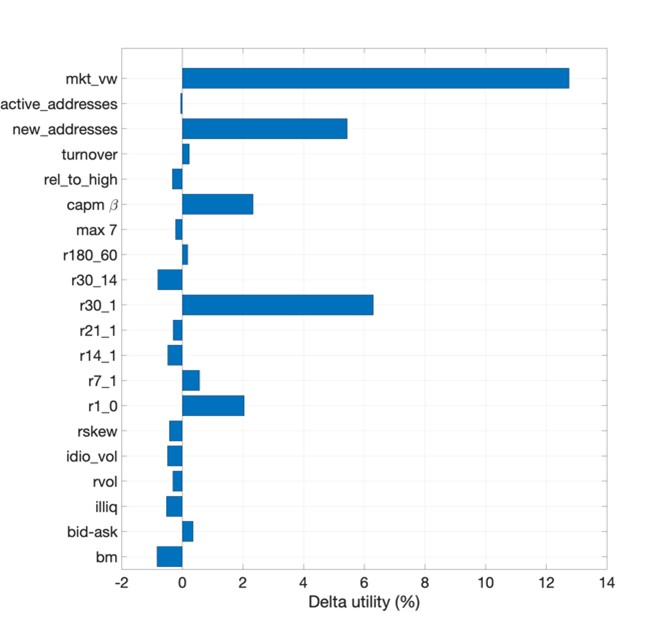
Where SR2new represents the Sharpe ratio obtained from the volatility-managed crypto portfolio and SR2old the Sharpe ratio obtained from its original counterpart. The right panel of Figure 3 shows the results. The evidence suggests there is a significant utility gain only for a handful of cryptoasset portfolios, such as 30-day momentum (r30_1), new addresses and capm β. For example, a mean-variance investor who can only trade the 30-day momentum factor can increase her utility by 7% through volatility timing. However, consistent with the evidence in Figure 2 and the left panel of Figure 3, the utility gain does not apply to most cryptoasset portfolios.
Figure 3: Mean-variance efficiency and utility increase
Conclusions and remarks
Recent literature suggests investors can enhance risk-adjusted returns and utility by adopting simple trading rules that scale capital exposure in popular factor portfolios by their lagged variance. The trading strategies implied by these studies typically take one of two forms: direct investments in volatility-managed portfolios or combination portfolios that invest in both the volatility-managed version and the original version of an underlying strategy.
This article provides some preliminary evidence that neither of these methods suggests a pervasive link between volatility management and improved performance in the context of cryptoassets. Utility gains and improvements to risk-adjusted are mostly confined to a handful of factor portfolios based on 30-day momentum, new addresses and market betas.
One caveat of this article is that the empirical analysis is based on the idea that investors aim at maximising risk-adjusted returns in the form of Sharpe ratios. However, although the Sharpe ratio is essential, most investors have broader investment objectives. For instance, Harvey et al. (2018) show that volatility scaling reduces the likelihood of extreme returns (and the volatility of volatility). In particular, the lower probability of very negative returns (left-tail events) may be particularly valuable for investors (see Bianchi et al. 2023). This aspect deserves a more careful discussion in future research.
Bibliography
Amihud, Y. (2002). Illiquidity and stock returns: cross-section and time-series effects. Journal of financial markets, 5(1):31–56.
Bali, T. G., Cakici, N., and Whitelaw, R. F. (2011). Maxing out: Stocks as lotteries and the cross-section of expected returns. Journal of financial economics, 99(2):427–446.
Barillas, Francisco, and Jay Shanken. "Which alpha?." The Review of Financial Studies 30.4 (2017): 1316-1338.
Bianchi D., A. De Polis, and I. Petrella. Taming momentum crashes. Working paper, 2023.
Bianchi, D., Babiak, M., and Dickerson, A. (2022). Trading volume and liquidity provision in cryptocurrency markets. Journal of Banking and Finance, forthcoming.
Bianchi, D. and Babiak, M. (2022). A risk-based explanation of cryptocurrency returns, working paper
Bianchi, D. and Babiak, M. (2023). Cryptocurrency as lotteries?, mimeo
S. Cederburg, M. S. O’Doherty, F. Wang, and X. S. Yan. On the performance of volatility-managed portfolios. Journal of Financial Economics, 138(1):95–117, 2020.
Cong, L. W., Karolyi, G. A., Tang, K., and Zhao, W. (2021b). Value premium, network adoption, and factor pricing of cryptoassets. Working Paper.
Fama, E. F. and French, K. R. (1993). Common risk factors in the returns on stocks and bonds. Journal of financial economics, 33(1):3–56.
M. R. Gibbons, S. A. Ross, and J. Shanken. A test of the efficiency of a given portfolio. Econometrica: Journal of the Econometric Society, pages 1121–1152, 1989.
C. R. Harvey, E. Hoyle, R. Korgaonkar, S. Rattray, M. Sargaison, and O. Van Hemert. The impact of volatility targeting. The Journal of Portfolio Management, 45(1):14–33, 2018.
O. Ledoit and M. Wolf. Robust performance hypothesis testing with the sharpe ratio. Journal of Empirical Finance, 15(5):850–859, 2008.
Liu, Y., Tsyvinski, A., and Wu, X. (2022). Common risk factors in cryptocurrency. The Journal of Finance, 77(2):1133–1177.
A. Moreira and T. Muir. Volatility-managed portfolios. The Journal of Finance, 72(4):1611–1644, 2017.
Haftungsausschluss